Preface:
Have you ever ran a command in linux and later went “Hmm… What did I just run” (hint: bash history is your friend at times). How about in Ansible when you ran a big playbook but then realized you had to scroll back up to see what was happening (especially if a task in your playbook as “ignore_errors: true”).
Alright, those can be overcome fairly easily, but now imagine you are working in a Cybersecurity SOC, or you are responsible for reviewing log files, or you have to remain compliant for various cybersecurity frameworks. How can you feed what you (or anyone on the team) has done in Ansible/AWX to Splunk?
AWX and Ansible <3 Splunk
So I did a little digging over the weekend and found that there is actually several TA’s in Splunk that support Ansible/AWX

I found there were also several guides out there from RedHat talking about Aggregating Ansible Tower logs to Splunk. Some of these were a little dated (3 years from the date of this post) and there have been several revisions of Ansible, Ansible Tower and AWX, so I wanted to see if I could also replicate this article and incorporate logging myself with my own Splunk instance in my homelab. So for this demo, we will need a working AWX instance (unless you happen to have Ansible Tower) and a working Splunk Enterprise instance.
Splunk HTTP Event Collector (HEC)
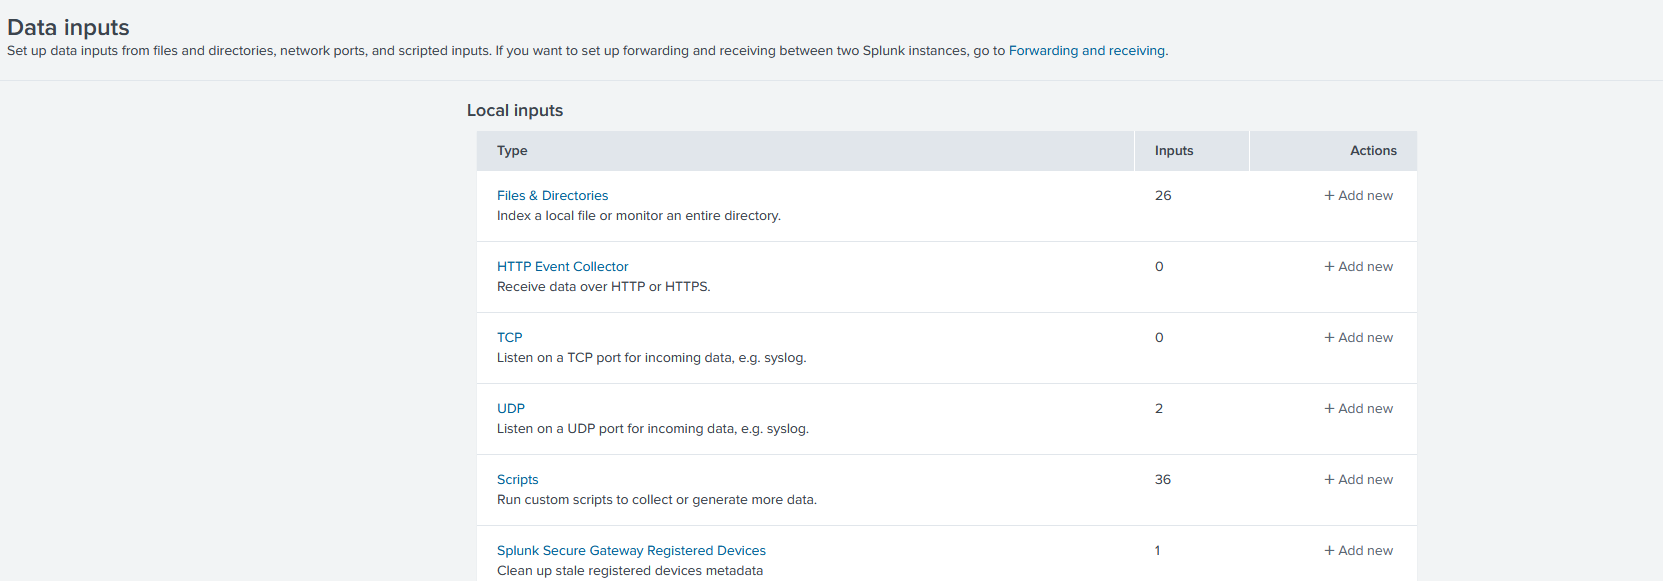
Starting off, we will utilize the Splunk HTTP Event Collector (HEC) which will allow incorporating AWX Logs into Splunk. In Splunk -> Settings -> Data Inputs -> HTTP Event Collector (might be on page 2).
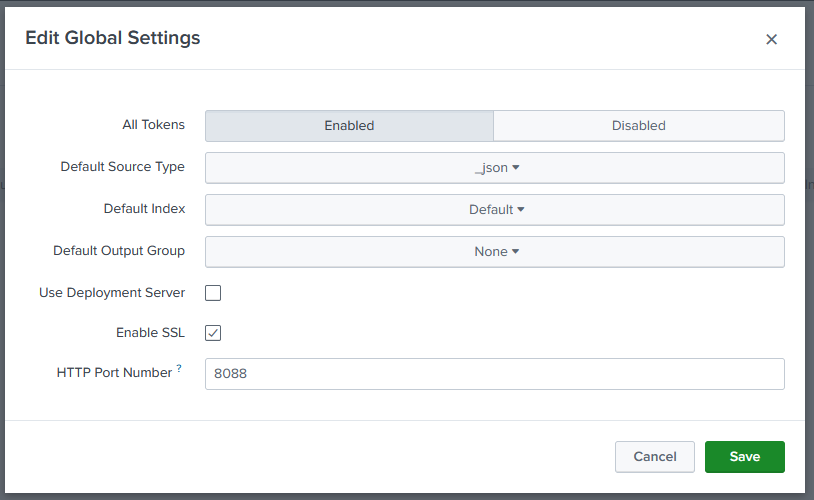
Next select “Global Settings”, and in this menu select “All Tokens - Enabled” and for Default Source Type select “Structured -> _json”
Keep the rest of the settings. Then click “Save”
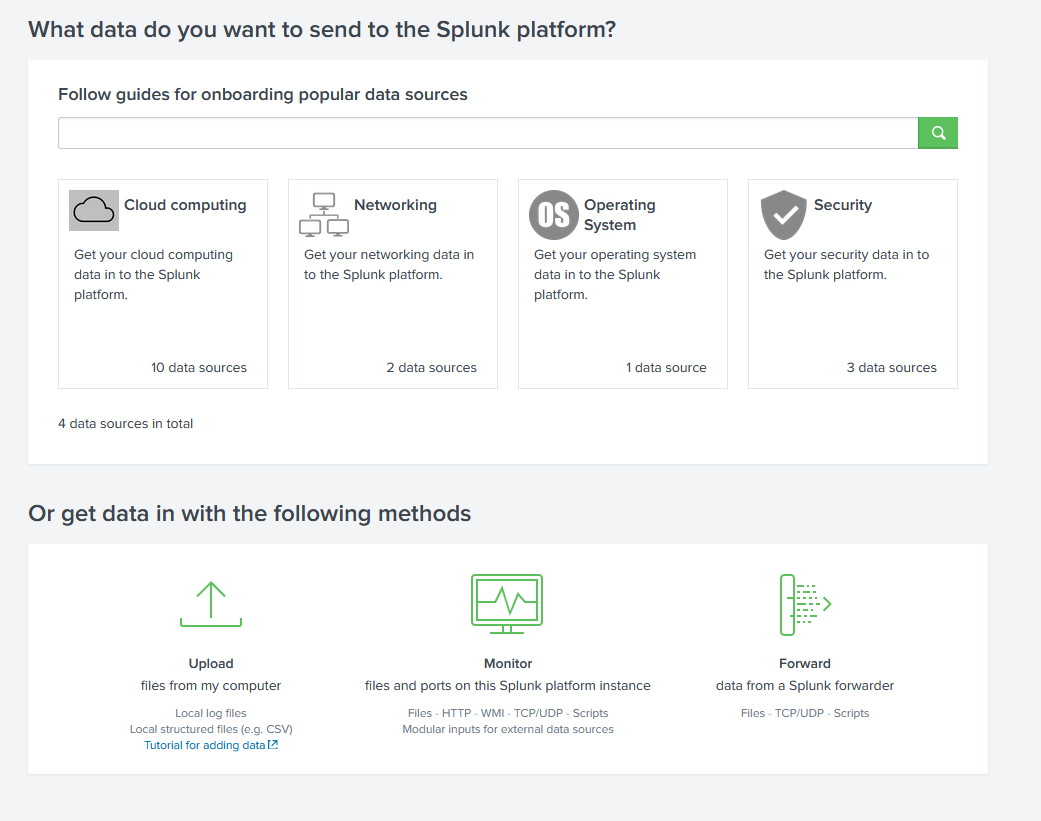
Now click “Settings” and “Add Data”, on the bottom click “Monitor”
In the next screen click “HTTP Event Collector”
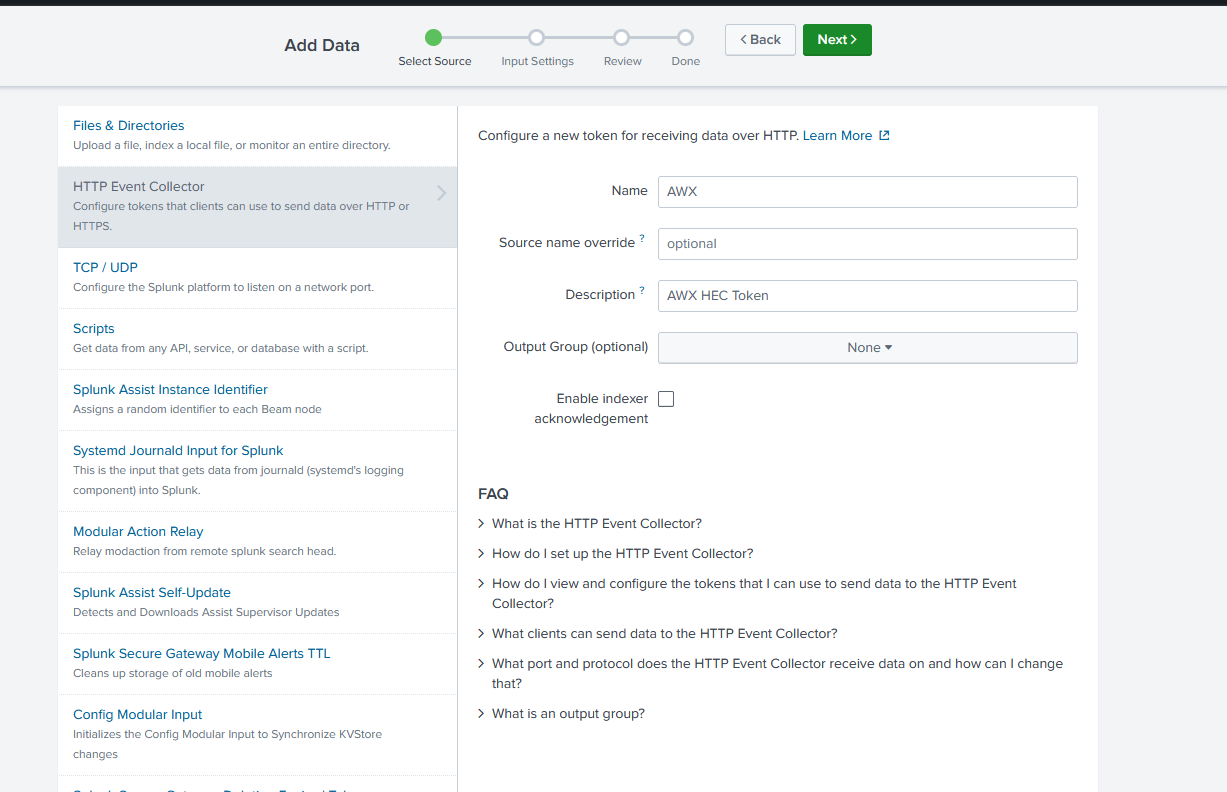
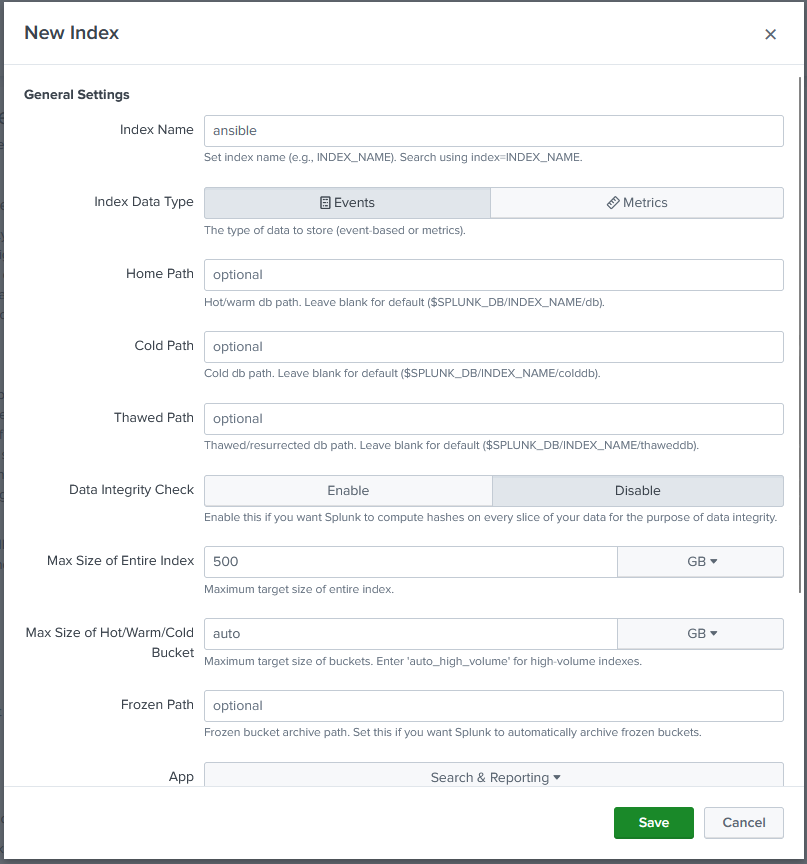
On the next screen click “New Index” unless you have an Ansible Index already. Then create a new index to ingest/collect the logs from AWX
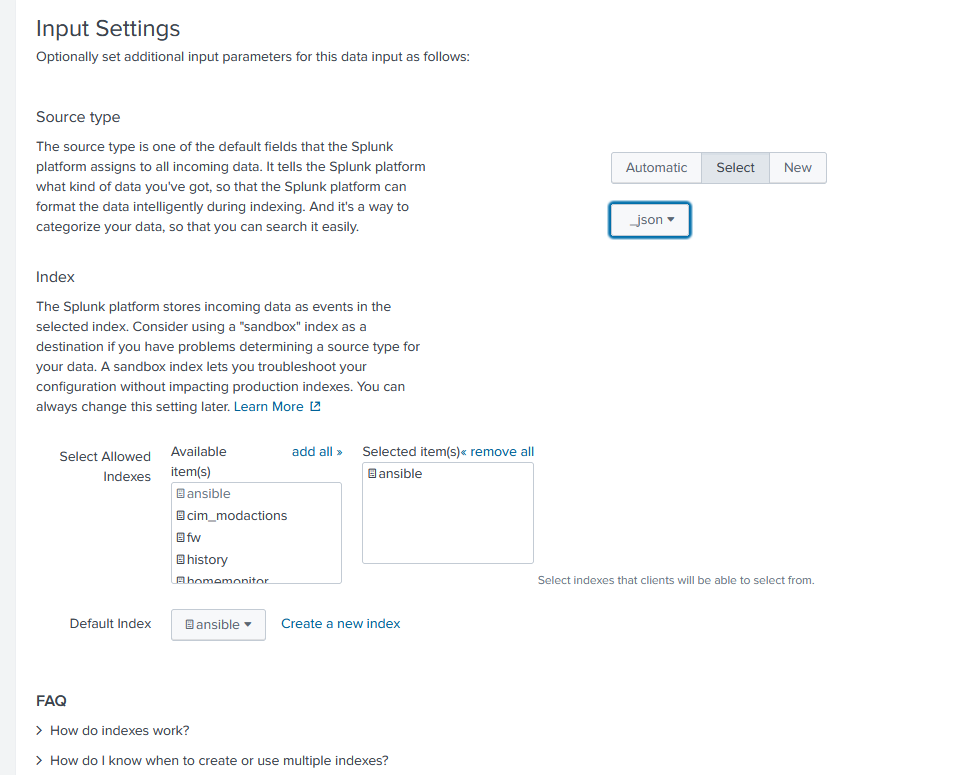
On the source type click “Select” then “Structured” -> “_json”.
Click “Review” on top and “Submit”. You should be greeted with “Token has been created successfully” at the end. Copy this token. If you forget you can find it in “Data Inputs” and the HTTP Event Collector page (It will be newly created).
Click on Start Searching and leave this screen up
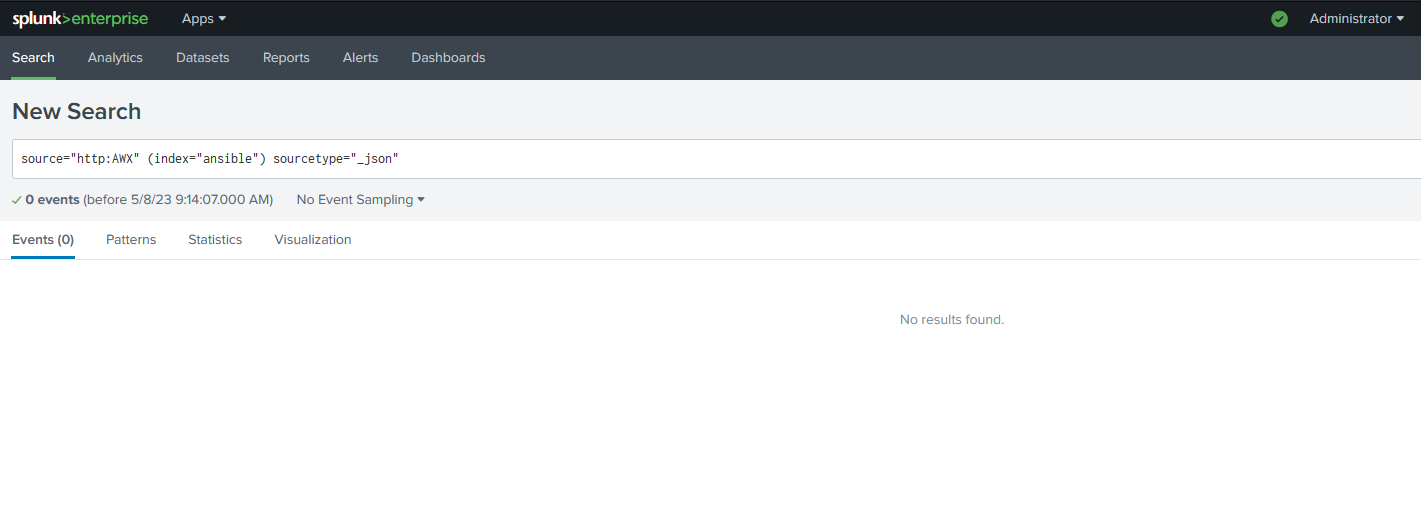
Now it’s time to set up AWX
AWX Settings
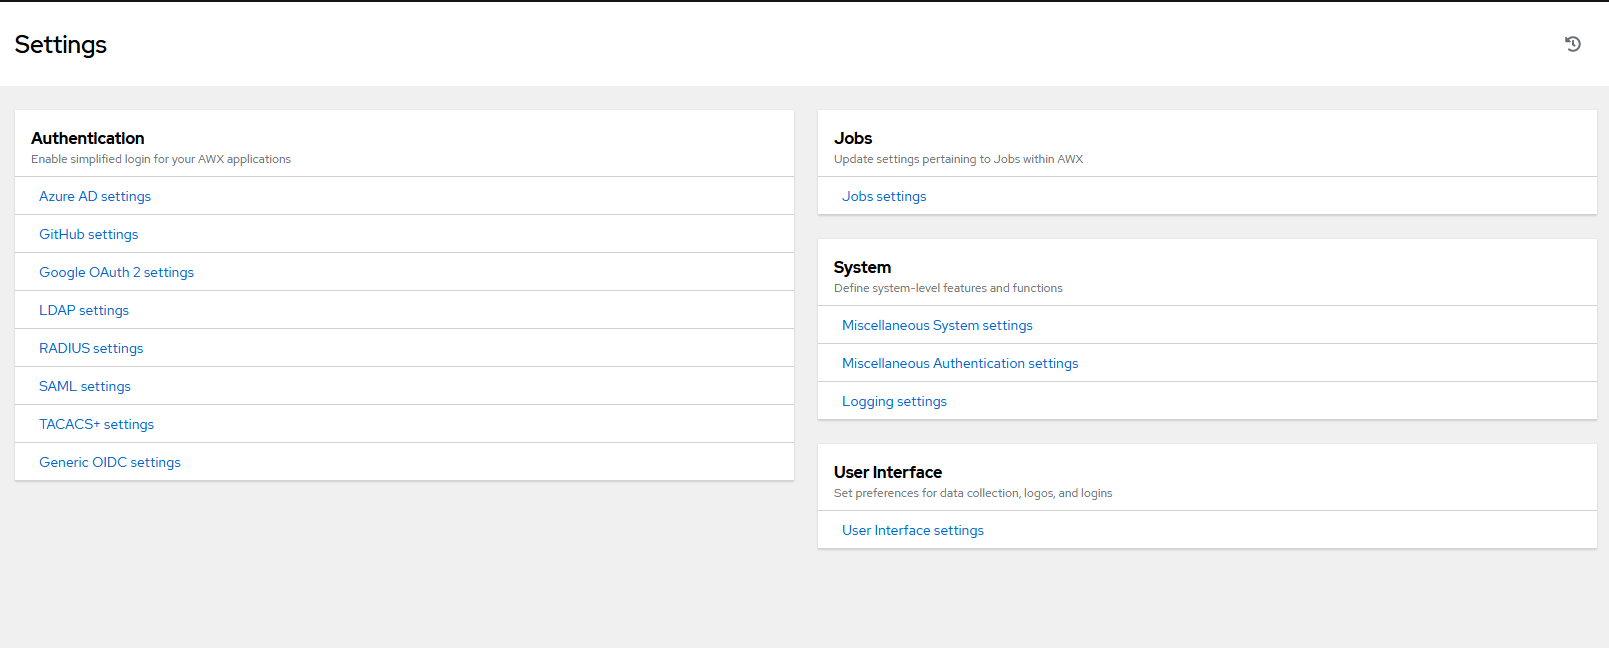
In AWX/Ansible (should be the same) click on “Settings” on the bottom left then click “System” -> “Logging Settings”
In AWX click on “Edit” on the bottom, which will allow you to edit the fields.
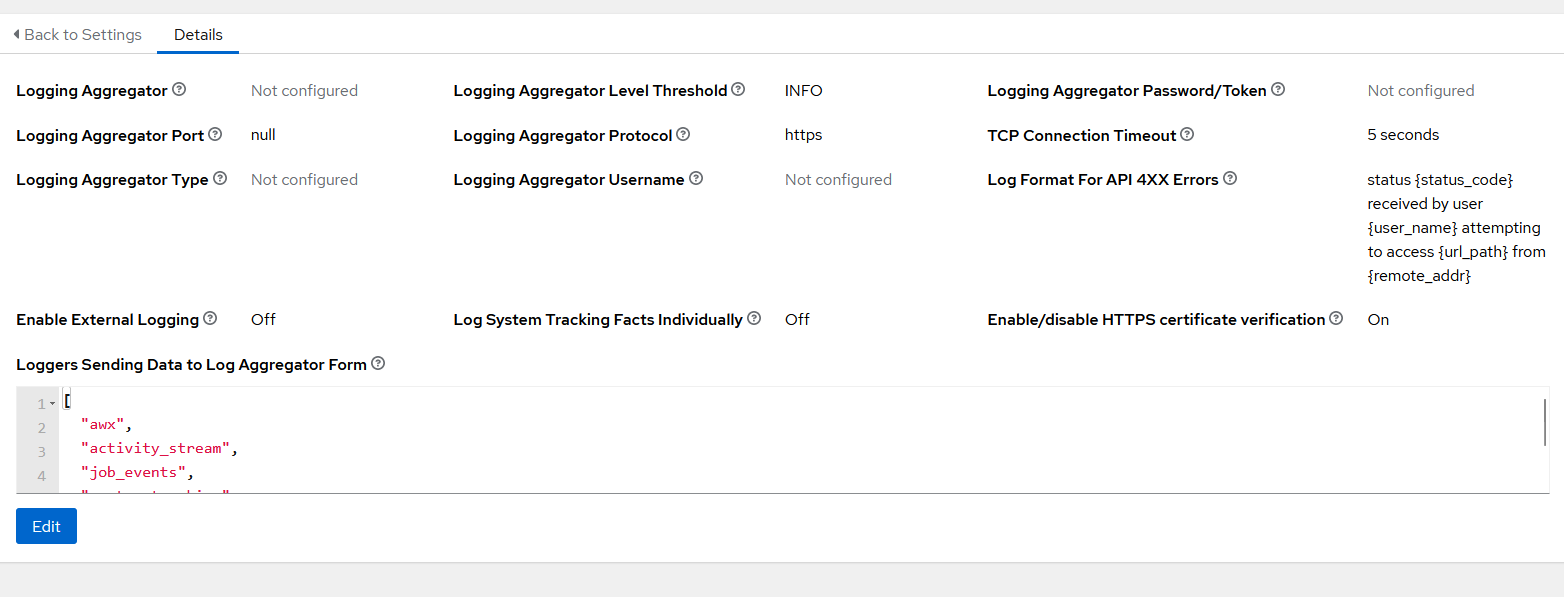
Here you can’t click on “Enable External Logging”, however it’s due to the fact that we do not have the fields filled out yet (prevents sending logs to no-where land, ask my Firewall when I turn off my Splunk Instance)
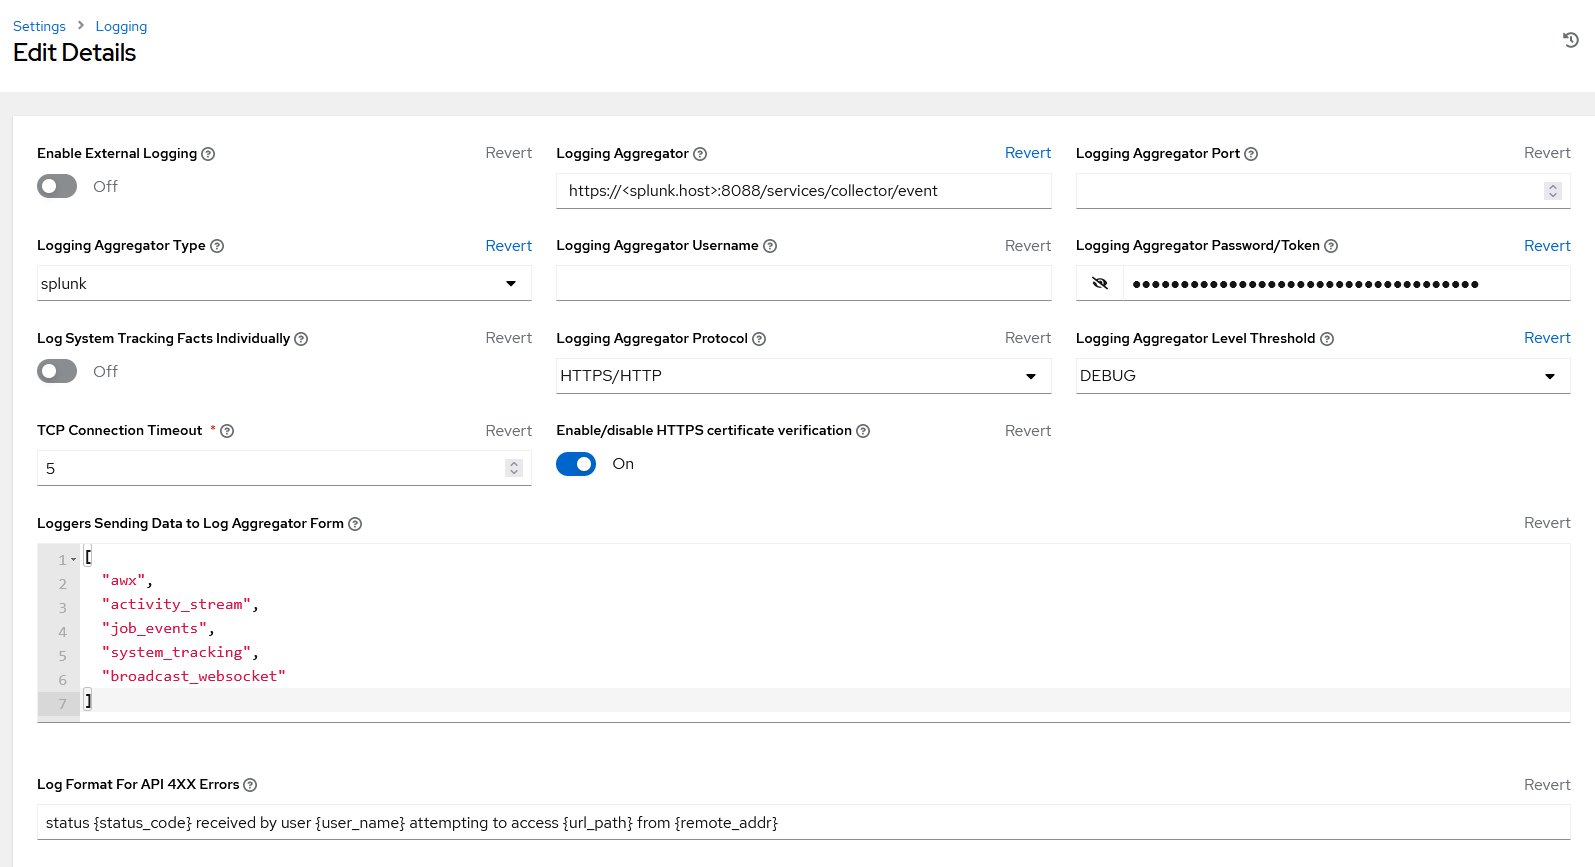
Please note - For the “Logging Aggregator” input the actual Splunk instance hostname/IP address in there. Also ensure that this port is OPEN on your Splunk Machines Firewall.

Also another note: If you do not have SSL/TLS Certificates SIGNED BY A CA (i.e. you are running Self-Signed Certificates) you will run into a problem if you do not disable “Enable/disable HTTPS certificate verification”. The problem? You won’t get logs.
Now that everything is set up lets start checking Splunk to see if any logs are being passed to it.
Splunk Search
Refresh your Splunk search page, click on the search button, check your indexes on the Settings page, whatever you have to do to see if the Data is flowing in.

Using the TA’s
Now its time to install the TA’s. Go to “Apps” and “Find more Apps”. Search for “Ansible”. For this demo I’ll use the “Ansible Monitoring and Diagnostics” as this one is updated frequently AND it is also one recommended by RedHat.
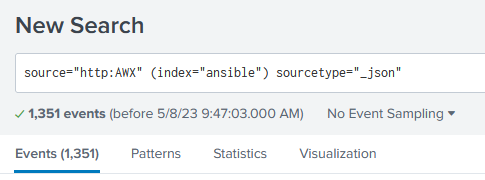
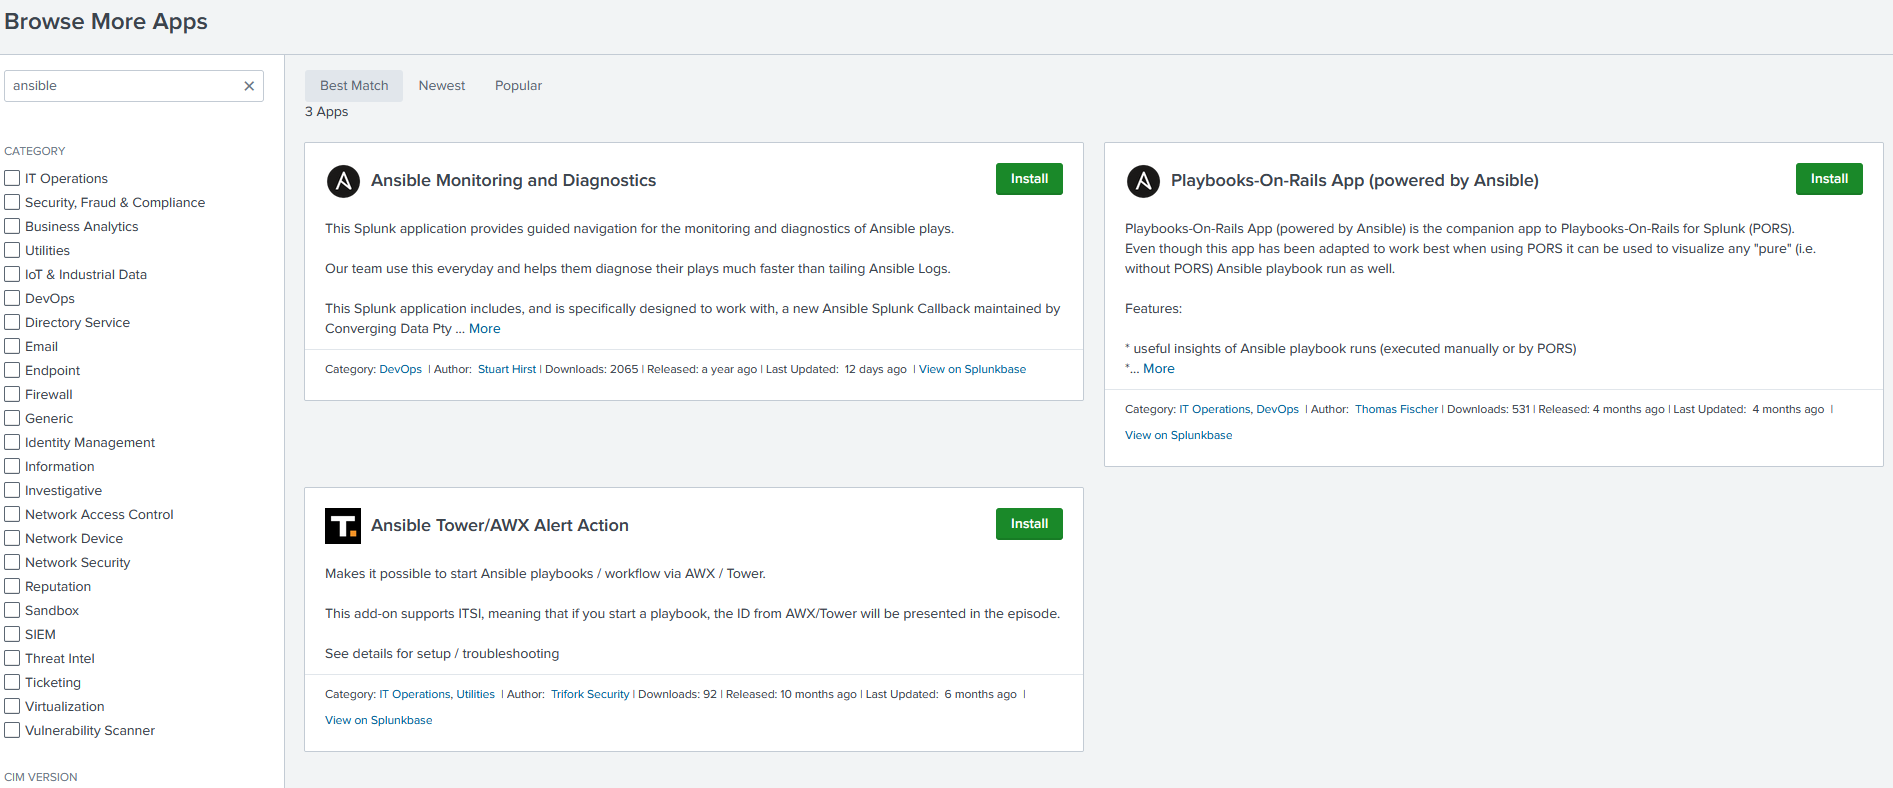
No I’m not going to lie, I’m still tinkering with the “Ansible Monitoring and Diagnostics” application, as the data I have isn’t ingesting correctly. I followed their set up, used their python script, and still not getting results parsed. I’m trying to troubleshoot that, HOWEVER, it doesn’t stop me from actually getting some statistics into a dashboard. Formulating Queries in Splunk is rather simple. For example, I can get a list of all the playbooks ran (Since the dawn of time) by running this query:
source="http:AWX" (index="ansible") sourcetype="_json" playbook=* event=playbook_on_task_start
This will list any playbooks that have “Started”, regardless if they failed, finished, etc. You can customize this further and get into the nitty-gritty, and even customize dashboards as needed.