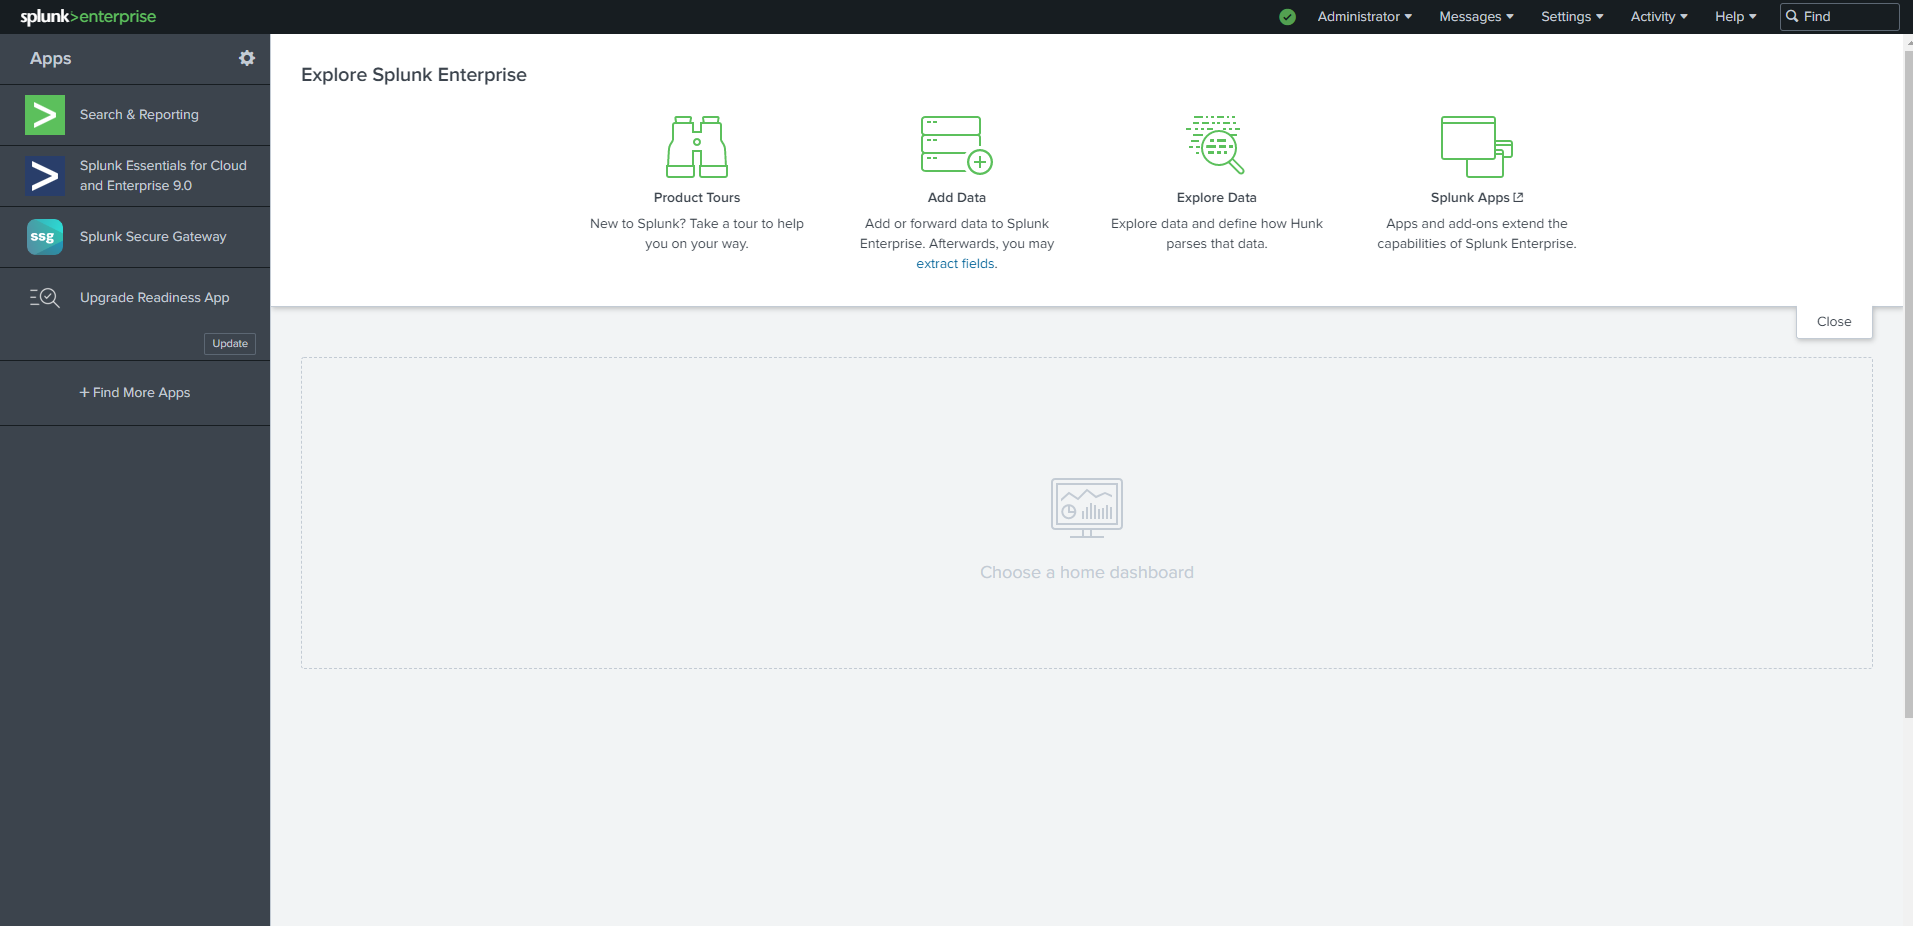
So now that we are back on our Splunk Dashboard, first things first, we are going to set up out Administrator Information (Administrator -> Account Settings)
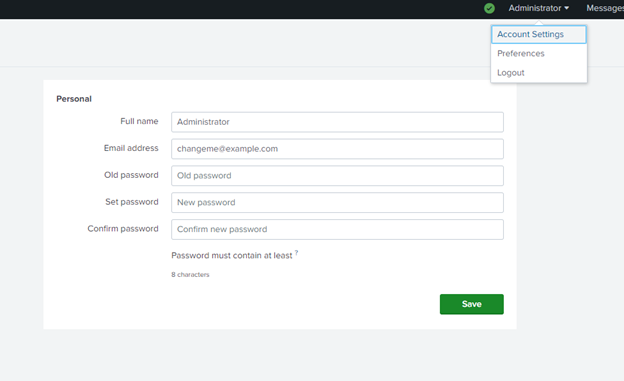
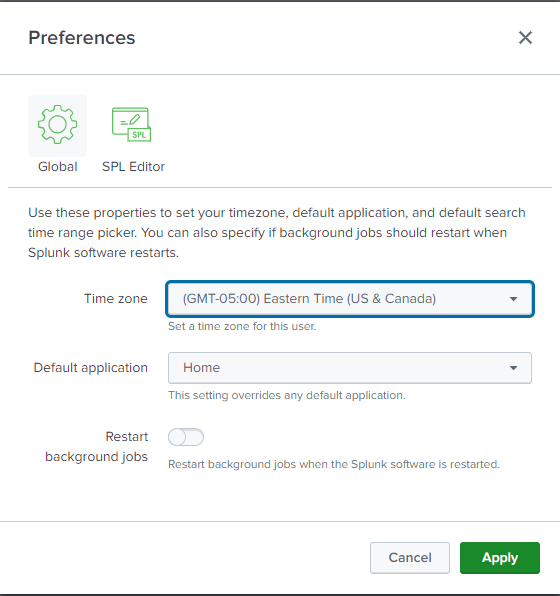
Then on the next line under “Account Settings” under Administrator, set your Time Zone. For me I’m going to select Eastern Time.
Next I’m going to change my license (since I have a developers license). This is fairly straight forward, they e-mail you a file to upload.
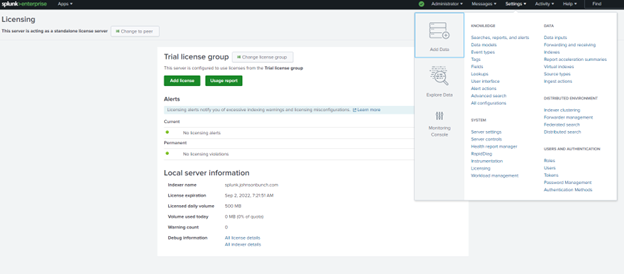
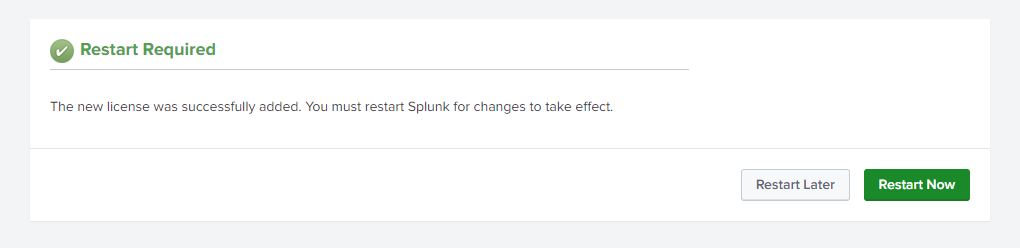
Ahh, much nicer, even though starting off I may not hit 500MB a day in logs, eventually as I grow my mock infrastructure and begin to start pushing every log I can think of I’m sure I can start going over it.
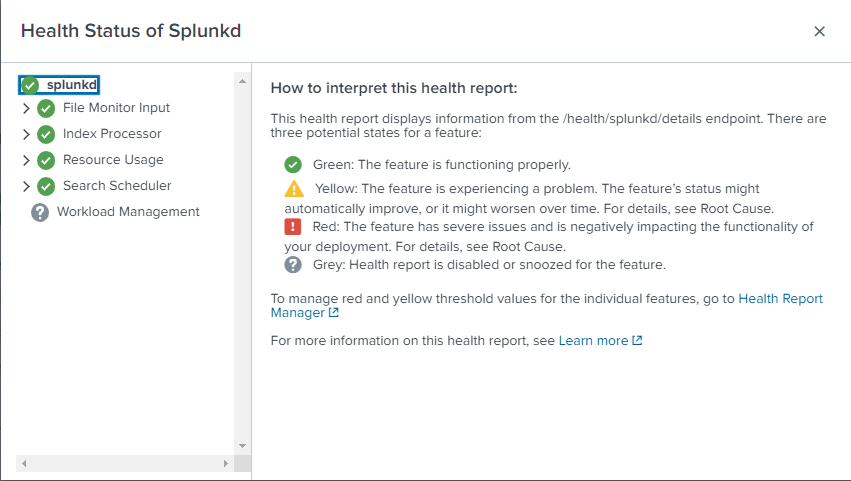
Now before we start digging into the weeds of Splunk, one important note I want to mention: The green Check Mark on the top bar:

If you click on that it will give you a high-level overview of you current Splunk System status and warn you of any impending issues that your Splunk instance(s) may have. This is important for performance. I found on a previous instance I had ran before that my index processor was Yellow and Index Optimization was out of whack. I believe this was due to running on an NFS storage share and the latency behind it.
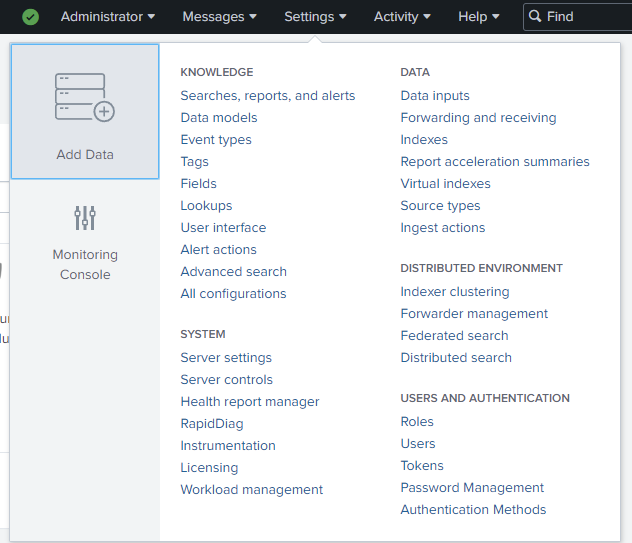
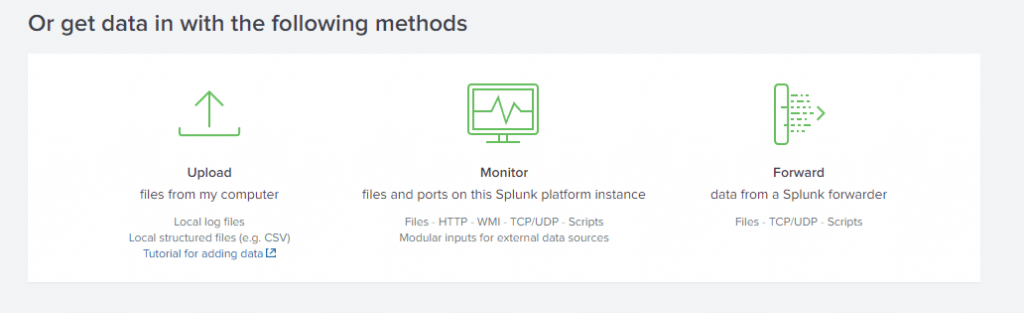
Now that our licensing is set up, let’s start feeding our instance some data. There are several options of feeding Splunk data, Under Settings -> Add Data:
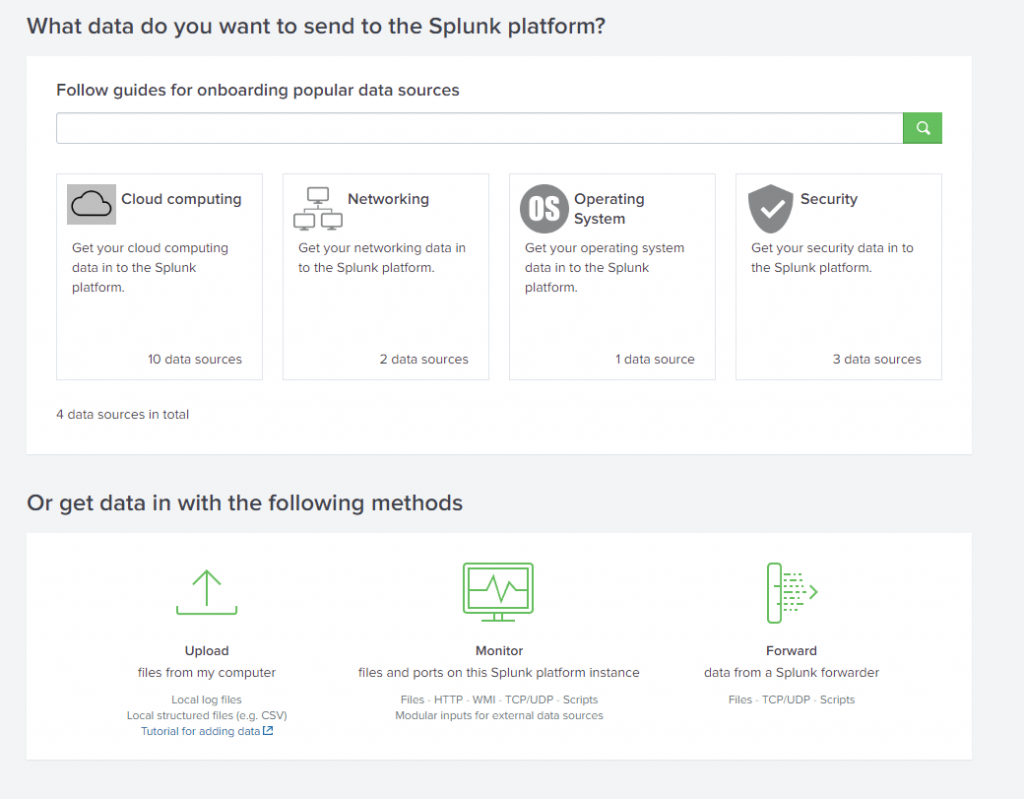
You can see there are several guides you can follow, or you can even use the bottom three options (Upload log files, monitor files/ports on the same Splunk instance, or Forward Data). If you are handling log files taken directly from the source, then you would upload them here, and while eventually I will set up and monitor this Splunk instance, that is fairly straight forward and not as fun. The third option is to Forward the data to this instance, however I’m not using a Forwarding Server, instead I’ll utilize individual Universal Forwarders installed directly on each of my hosts/servers to aggregate logs/data for me:
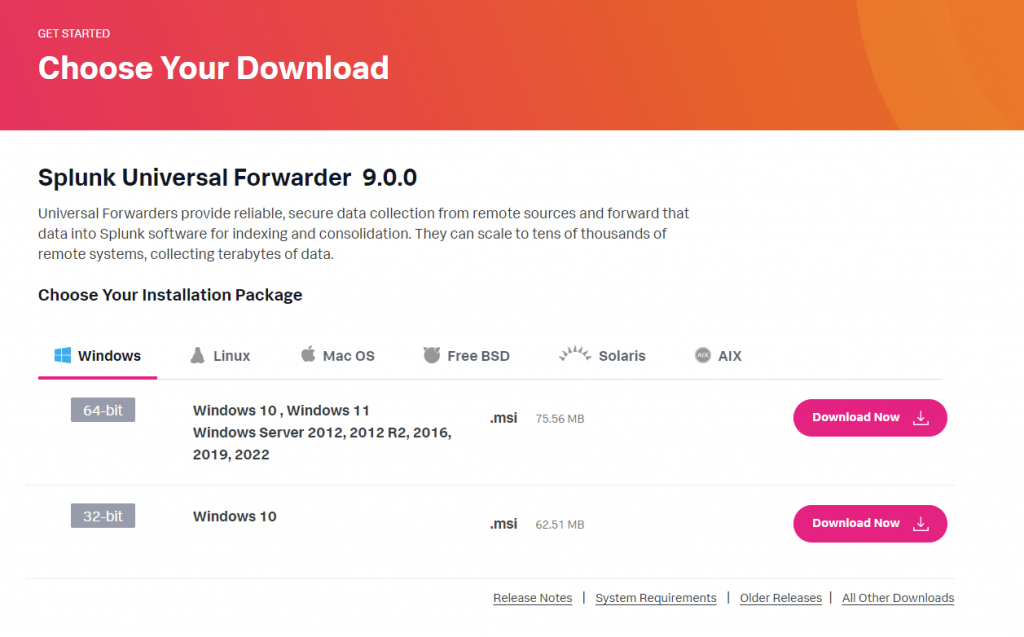
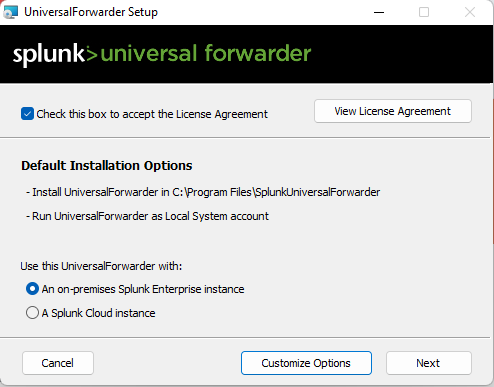
This little tool is awesome, and a lifesaver. I’m going to install it on my Windows Desktop so I can start pushing all of its log files from it to my Splunk instance.
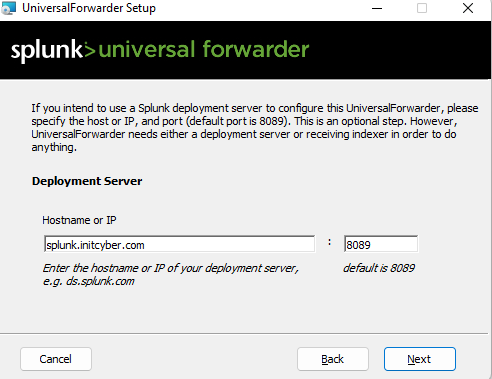
As a side note, ensure that these ports are opened before proceeding forward. I forgot to do this before hand (ran into errors) so I opened up ports 8089 and 9997 (both TCP) on my Splunk Server for the Splunk Forwarder to properly communicate with my Splunk instance.
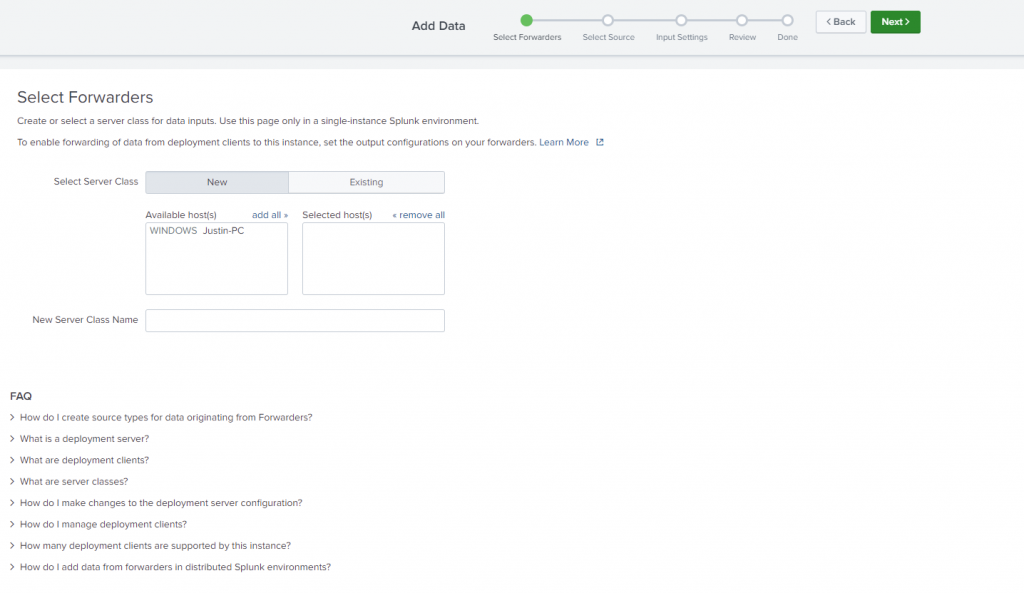
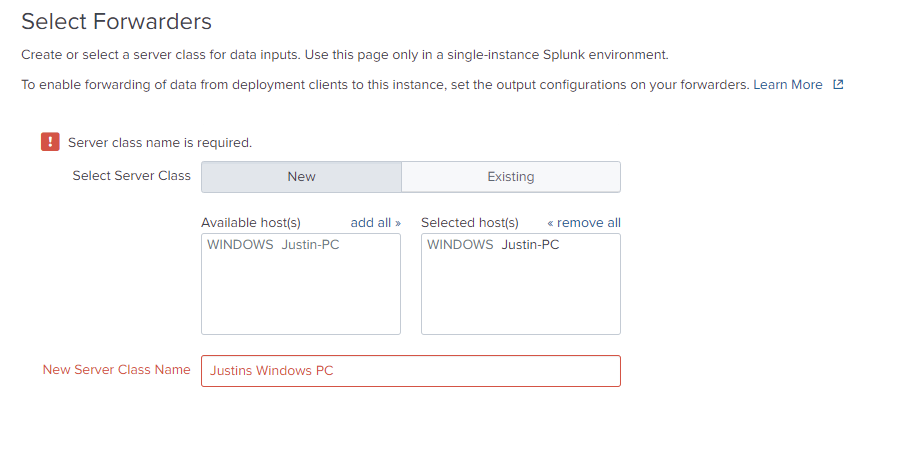
Now back to that Add Data Screen, select “Forward”
As you can see, I now have the option to select my Windows PC. Before if you clicked on this without a Universal Forwarder set up it would not have anything populated here.
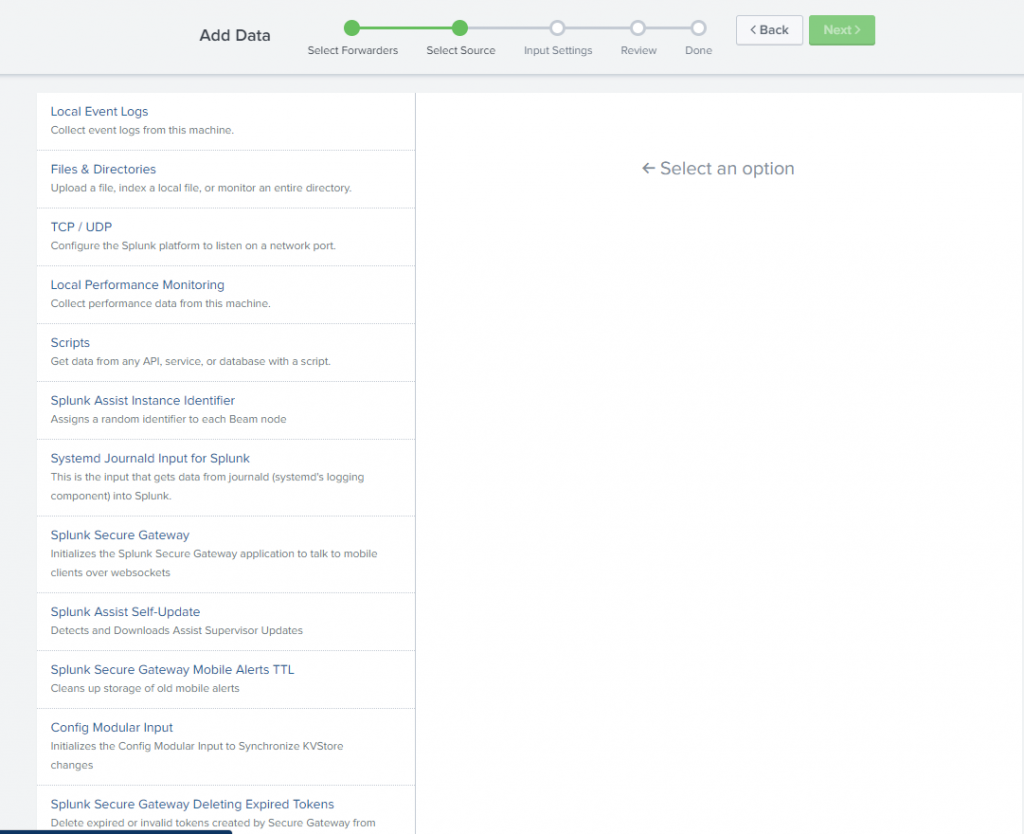
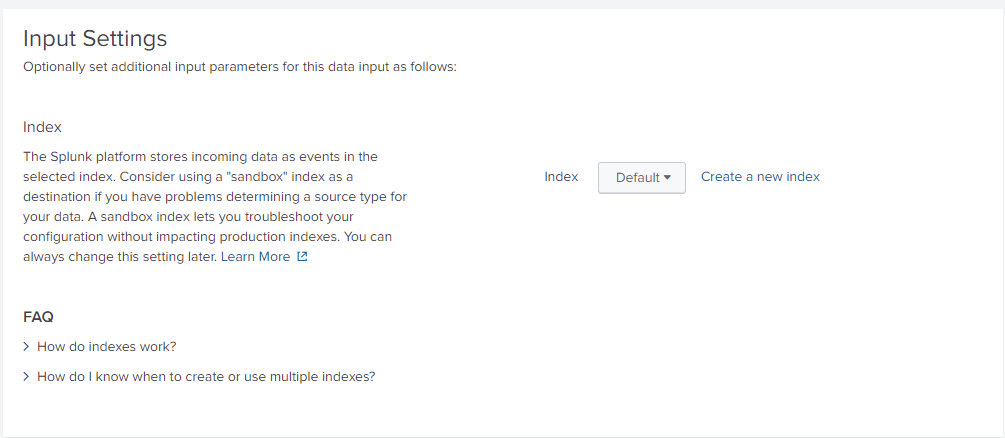
This next screen asks what data you want Splunk to monitor/forward from the Universal Forwarder to the Splunk Instance. Select what you want forwarded to the Splunk Server. You could select all and go crazy, however I don’t want to flood my server with everything, just Local Event Logs, and I’ll add all available options. If this was one of my production servers I would add TCP/UDP and other metrics to monitor, but in this instance, this computer doesn’t talk to the outside world with the exception of ephemeral ports/web surfing.
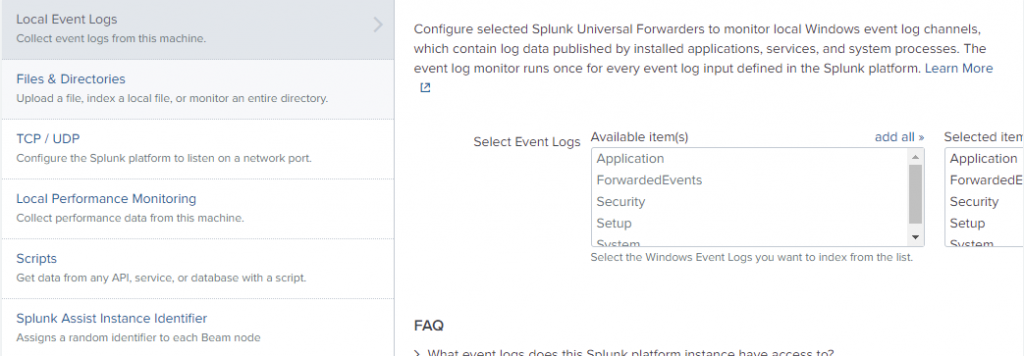
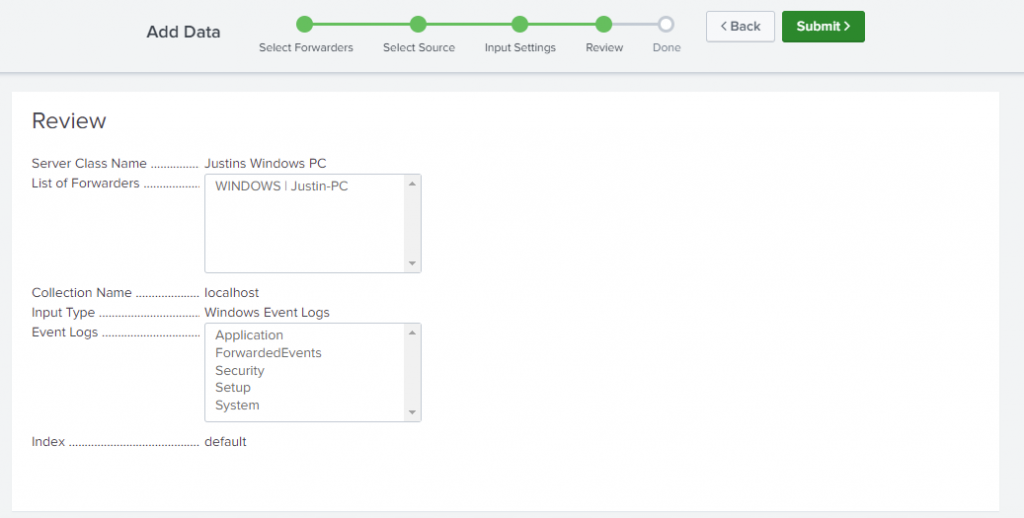
Select the logs you want to forward then click next
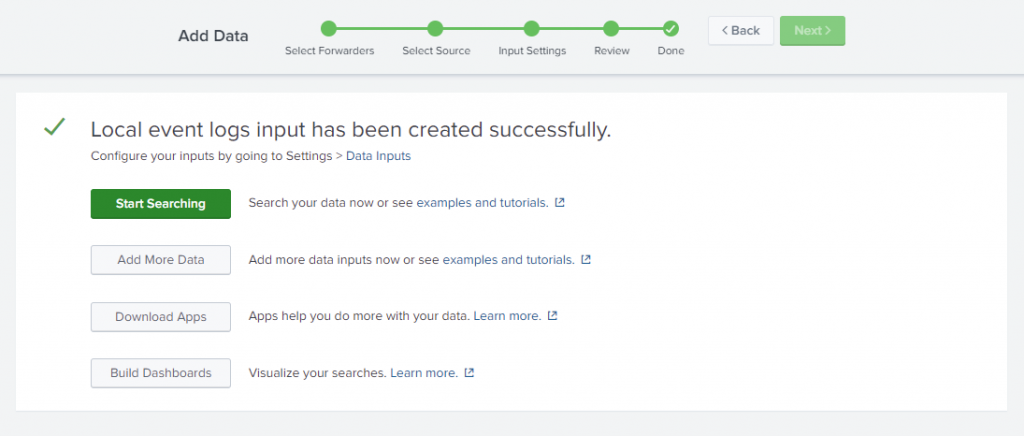 So, the last screen lets to do MORE with your data, from here your logs are now being forwarded and aggregated to a Central Logging solution where you can search through them, download various apps to manipulate through it and even build dashboards for your data (more on this tomorrow).