
Yesterday we left off with installing the universal forwarder on Windows and managing it from our Splunk Enterprise installation. What I didn’t mention was installing the universal forwarder on a Linux based operating system. Let’s get more data into out Splunk Enterprise instance.
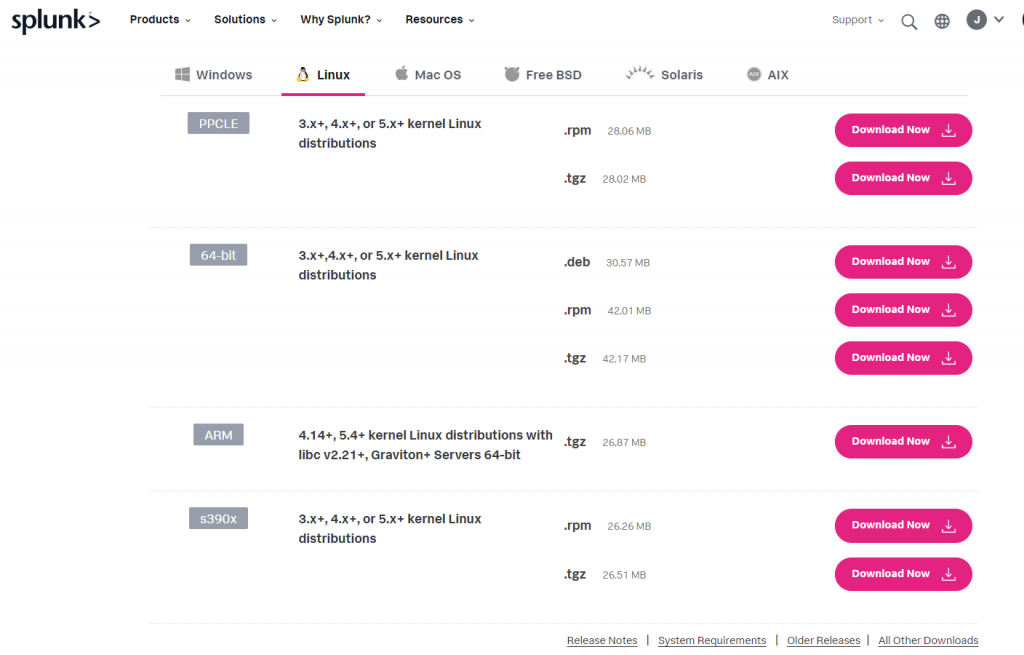
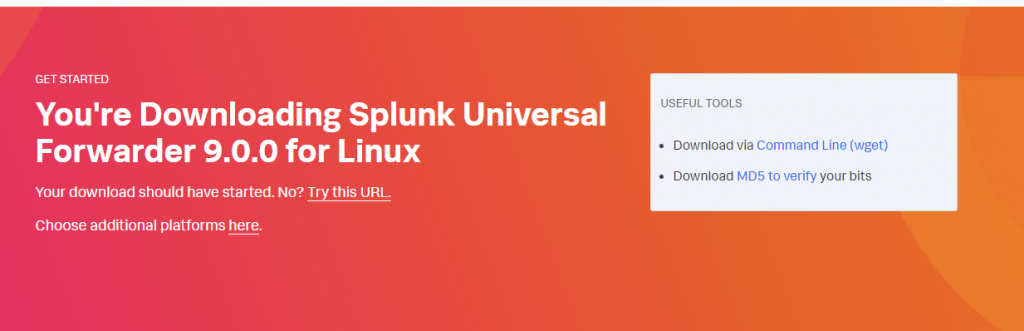
First lets visit the Splunk Downloads page and grab the URL for our Universal Forwarder. If we had a GUI we could simply download it from here, or we could SCP the file over through SSH from our host computer, however I prefer directly downloading the file using their provided wget command:
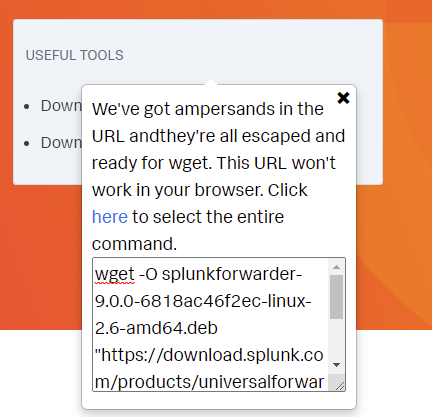
Now lets SSH over to our Linux box and download the universal forwarder
$ wget -O splunkforwarder-9.0.0-6818ac46f2ec-linux-2.6-amd64.deb "https://download.splunk.com/products/universalforwarder/releases/9.0.0/linux/splunkforwarder-9.0.0-6818ac46f2ec-linux-2.6-amd64.deb"
and install it (in this case, since it’s Ubuntu/Debian based, and a .deb file):
$ sudo dpkg -i splunkforwarder-9.0.0-6818ac46f2ec-linux-2.6-amd64.deb
This will install the Splunk Universal Forwarder into the “/opt/splunkforwarder” folder. From here setup is pretty straight forward. Let’s start the Splunk Forwarder, go into the /opt/splunkforwarder folder if not already in it then start the forwarder:
$ cd /opt/splunkforwarder
$ sudo ./splunk start --accept-license
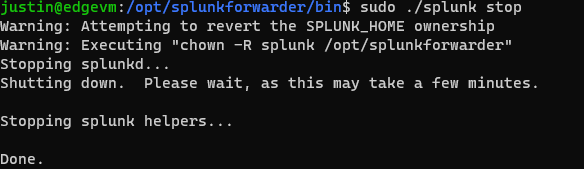
It should ask you initially to create a username and password. This username and password is for the Universal Forwarder installed here. Next let’s enable the Universal Forwarder to start at boot, first stop Splunk, then enable it.:
$ sudo ./splunk stop
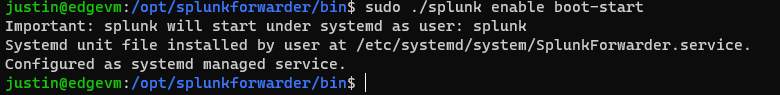
$ sudo ./splunk enable boot-start
Now let’s set up the Universal Forwarder to reach out to our Splunk Enterprise “all in one” instance for instructions on what to forward/how to forward logs/information (i.e. the deployment server). In a typical enterprise environment you would have a deployment server set up that would be responsible for this task, however in our #homelab we have everything tied into one. Let’s continue:
$ sudo ./splunk set deploy-poll splunk.initcyber.com:8089
This will automatically create our deploymentclient.conf file located at /opt/splunkforwarder/etc/system/local/deploymentclient.conf. If you want you can read through documentation and create this yourself, however I prefer using the CLI to have Splunk create this for me (either way is perfectly fine).
NOTE: You can very well use an IP address instead of a FQDN (replace splunk.initcyber.com:8089 with 192.168.x.x:8089 or whatever IP your Splunk Server is), however I prefer using a FQDN set by my Firewall/Router in the event that I change my network IP addresses around for whatever reason, I’m not having to track down several broken links. It’s also just a best practice.
Now let’s restart the Universal Forwarder:
$ sudo ./splunk restart
And back to our Splunk Enterprise instance:
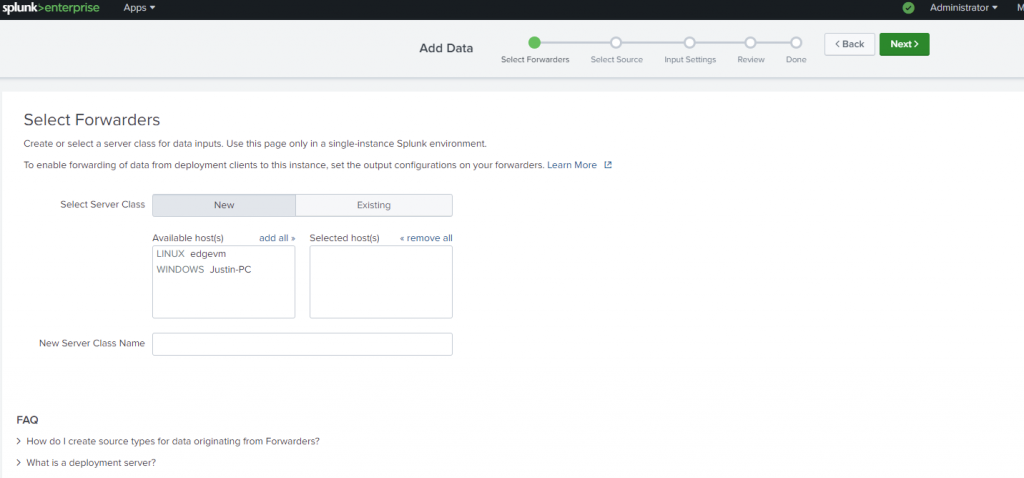
Continue on with adding this Linux host and configuring what logs to aggregate.
Let’s browse some Splunk Applications
From the Splunk homepage, click on “Splunk Apps” and lets search for “Windows”
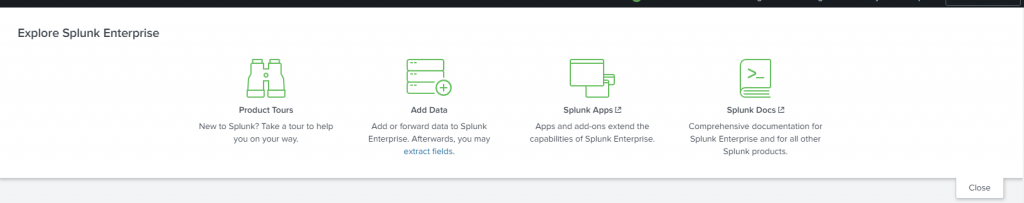
From the Splunk homepage, click on “Splunk Apps” and lets search for “Windows”
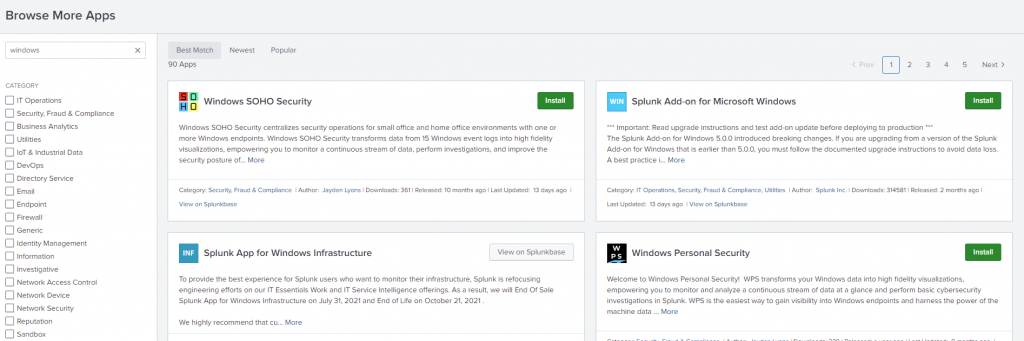
The Splunk Add-on for Microsoft Windows provides Splunk with better insight/data ingestion for Windows Products, Read more here: https://apps.splunk.com/app/742 and https://docs.splunk.com/Documentation/AddOns/released/Windows/AbouttheSplunkAdd-onforWindows
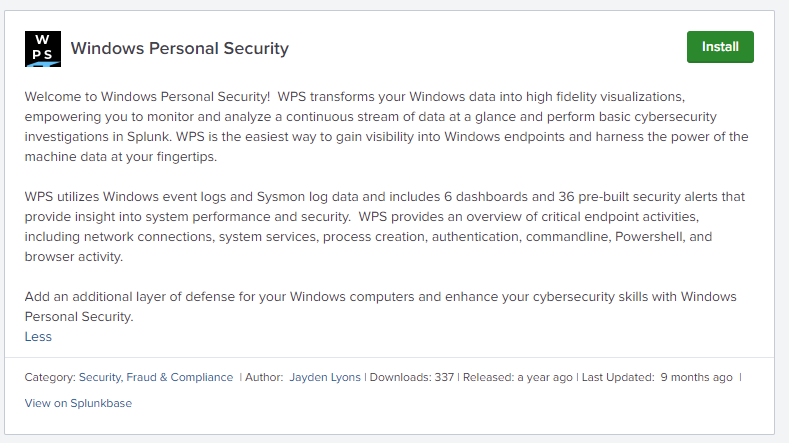
We’ll also install another Application, Windows Personal Security
After installing Windows Personal Security you can go to the dashboard and it provides you with an already configured template for Windows Event Log review:
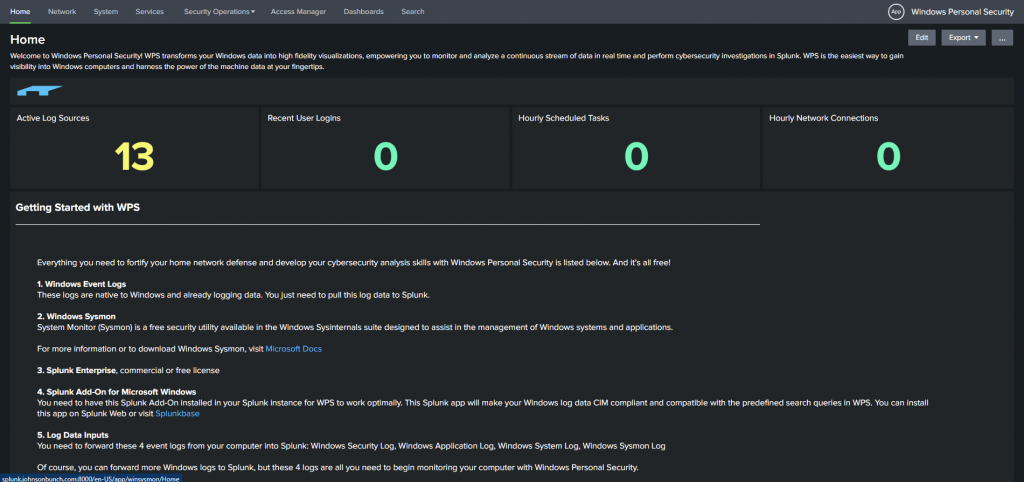
The top bar allows you to review different data sets, for example clicking on “System”
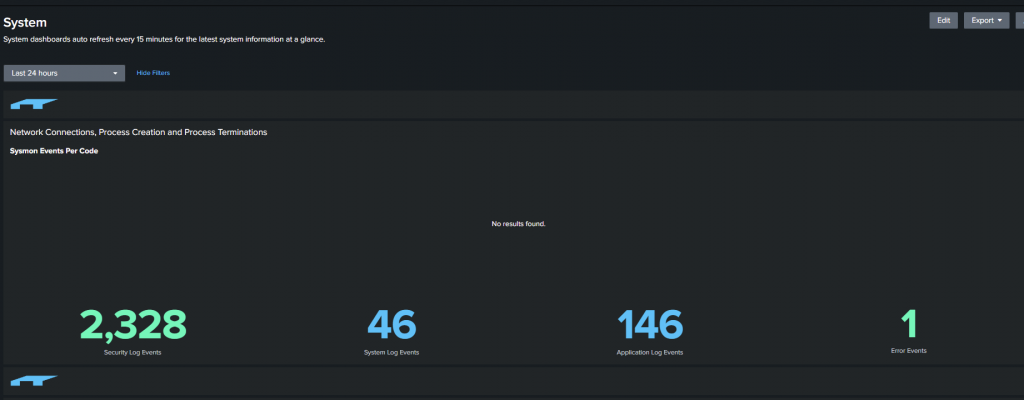
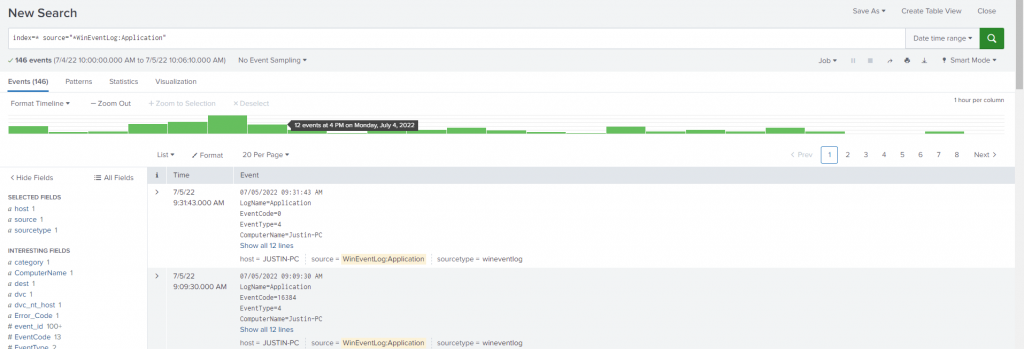
We can see there are several security log events for my Windows PC, Let’s take a look at the Application Log Events.
This has pre-defined searches within the log files you can review here, made up in a pre-configured dashboard.
You can also configure your own dashboard, to call your own searches, or if you are so inclined, subscribe and pay for other dashboards. Splunk is VERY versatile, for example you can connect to Nessus to ingest your vulnerability scans and keep a running history of your scans as well as have a dashboard you can log into. Your front page when you log into Splunk can be configured anyway you like it. The possibilities are ENDLESS and you can spend MONTHS setting up and configuring your dashboards/searches just the way you like them.