Video Here: https://youtu.be/olna19zwtoE?si=K-PJgKt6HW8Q0HJ_
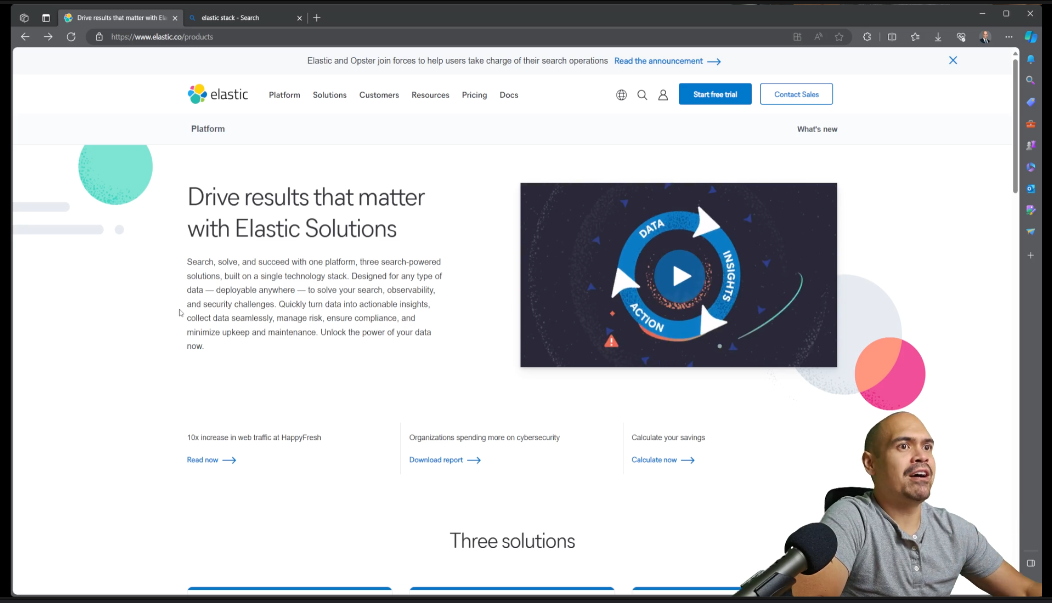
The Elastic Stack, also known as the ELK Stack is a powerful platform for data analysis and visualization that consists of three different tools: Elasticsearch, Logstash, and Kibana. A fourth tool, Beats, is commonly used to take data from various sources and send them to the stack. These tools work together to collect, process, and display data from various sources, such as logs, metrics, events, and more.

Some of the features and benefits of the ELK Stack are scalability, flexibility, reliability, and ease of use. It can deal with large amounts of data, work with various data types and formats, deliver fast and relevant search results, and provide a range of visualization and dashboard options. The ELK Stack can also work with other tools and frameworks, such as Apache Kafka, Apache Spark, and TensorFlow, to improve its abilities and functions.
Elasticsearch is a distributed, RESTful search and analytics engine that stores and indexes data in a JSON format, and provides fast and relevant search results. Elasticsearch is the core component of the ELK Stack, as it is responsible for storing and retrieving data, and performing complex queries and aggregations on the data. Elasticsearch uses a schema-less approach, which means that it can automatically detect the data structure and types, and create an index and a mapping for the data. An index is a logical collection of documents, and a mapping is a definition of the fields and properties of the documents. A document is a basic unit of information in Elasticsearch, and it consists of one or more fields, which are key-value pairs. A field can have different data types, such as text, number, date, geo-point, and more.
Elasticsearch also supports distributed and scalable architecture, which means that it can run on multiple nodes and clusters, and handle high availability, fault tolerance, and load balancing. A node is a single server that runs an instance of Elasticsearch, and a cluster is a group of nodes that work together and share data. Elasticsearch also uses a concept called shards and replicas, which are subsets of the index that are distributed across the nodes and clusters. A shard is a primary or a secondary copy of the index, and a replica is a backup copy of the shard. Shards and replicas help improve the performance and reliability of the system, as they allow parallel processing and data redundancy.
Elasticsearch also provides a rich set of APIs and DSLs, which are ways to interact with the system and perform various operations, such as indexing, searching, updating, deleting, and aggregating data. Elasticsearch supports RESTful APIs, which are HTTP methods that use JSON as the data format, and DSLs, which are domain-specific languages that use a query language called Query DSL, which is also based on JSON. Query DSL allows users to write complex and flexible queries and aggregations, and to specify different parameters and options, such as filters, scoring, sorting, highlighting, and more.
Logstash is a data processing pipeline that collects, parses, transforms, and enriches data from various sources, and sends it to Elasticsearch or other destinations. Logstash is the data ingestion component of the ELK Stack, as it is responsible for preparing and shaping the data before it is stored and analyzed in Elasticsearch. Logstash can handle different types of data sources, such as files, streams, databases, APIs, and more, and it can support different data formats, such as JSON, CSV, XML, and more.
Logstash also supports a modular and extensible architecture, which means that it can be customized and configured to suit different needs and scenarios. Logstash uses a concept called plugins, which are small pieces of code that perform specific tasks and functions in the data processing pipeline. Logstash has three types of plugins: input, filter, and output. Input plugins are used to read and collect data from the data sources, filter plugins are used to parse, transform, and enrich the data, and output plugins are used to send the data to the destinations, such as Elasticsearch, file, email, and more.
Logstash also provides a rich set of plugins, which are pre-built and ready to use, and it also allows users to create and use their own custom plugins, using Ruby as the programming language. Logstash also uses a configuration file, which is a text file that defines the pipeline structure and the plugins settings and parameters. The configuration file uses a simple and intuitive syntax, which consists of three sections: input, filter, and output. Each section specifies the plugins and their options that are used in the pipeline.
Kibana is a web-based user interface that allows users to explore, visualize, and dashboard data stored in Elasticsearch, and to create and share insights. Kibana is the data presentation component of the ELK Stack, as it is responsible for displaying and communicating the data and the analysis results in a meaningful and actionable way. Kibana can connect to any index or document in Elasticsearch, and it can perform interactive and real-time queries and aggregations on the data, using the same Query DSL as Elasticsearch.
Kibana also supports a variety of visualization and dashboard options, such as charts, graphs, maps, tables, and more, and it allows users to customize and configure the visualizations and dashboards according to their preferences and needs. Kibana also uses a concept called saved objects, which are reusable and shareable components that store the configuration and the state of the visualizations and dashboards. Saved objects can be exported and imported, and they can be accessed and managed through the Kibana UI or the API.
Kibana also provides some additional features and functionalities, such as Canvas, Lens, Machine Learning, Alerting, and more. Canvas is a feature that allows users to create dynamic and creative presentations and reports, using live data and custom elements. Lens is a feature that allows users to create powerful and easy visualizations, using a drag-and-drop interface and smart suggestions. Machine Learning is a feature that allows users to apply machine learning and anomaly detection techniques to the data, and to discover patterns and trends. Alerting is a feature that allows users to create and manage alerts, which are notifications that are triggered when certain conditions are met.
Beats are part of the Elastic Stack, which is an extension of the ELK Stack that includes other tools and frameworks, such as APM, Security, Enterprise Search, and more. It can handle different types of data, such as logs, metrics, network, security, audit, and more, and they can support different data formats, such as JSON, CSV, XML, and more.
Beats also support a modular and extensible architecture, which means that they can be customized and configured to suit different needs and scenarios. Beats use a concept called modules, which are pre-built and ready to use configurations for specific data sources, such as Apache, MySQL, Docker, and more. Beats also use a concept called processors, which are plugins that perform specific tasks and functions in the data processing pipeline, such as parsing, filtering, enriching, and more.
Beats also provide a rich set of modules and processors, which are pre-built and ready to use, and they also allow users to create and use their own custom modules and processors, using YAML as the configuration language. Beats also use a configuration file, which is a text file that defines the data source, the module, the processor, and the output settings and parameters.
Best Practices and Tips
Choosing the right data source, format, and structure: The ELK Stack can handle different types of data sources, formats, and structures, but it is important to choose the ones that are most suitable and relevant for your use case and analysis goal. For example, if you want to use the ELK Stack for web analytics, you might want to use data sources such as web servers, browsers, or APIs, and data formats such as JSON, CSV, or XML, and data structures such as nested, flat, or hierarchical. You also want to make sure that your data source, format, and structure are consistent, reliable, and accurate, and that they contain the necessary and sufficient information for your analysis. Optimizing the data processing and indexing: The ELK Stack can process and index large volumes of data, but it is important to optimize the data processing and indexing to improve the performance and efficiency of the system. For example, you might want to use Logstash to parse, transform, and enrich the data, and to remove any unnecessary or redundant fields or properties from the data. You also might want to use Elasticsearch to create and configure the index and the mapping for the data, and to use the appropriate index and document types, names, and settings, such as shards, replicas, refresh intervals, and more. You also want to use the optimal query and aggregation parameters and options, such as filters, scoring, sorting, and more, to reduce the query and aggregation time and complexity. Creating meaningful and actionable visualizations and dashboards: The ELK Stack can create and display a variety of visualization and dashboard options, but it is important to create and display the ones that are meaningful and actionable for your use case and analysis goal. For example, you might want to use Kibana to choose the appropriate visualization type and options, such as metric, pie chart, line chart, map, table, and more, and to specify the relevant metrics and dimensions, such as page views, sessions, users, bounce rate, and more. You also might want to use Kibana to customize and configure the visualizations and dashboards, and to add some titles and descriptions to the visualizations and dashboards, and to use the appropriate colors, fonts, sizes, and layouts. You also want to use Kibana to explore and analyze the visualizations and dashboards, and to interact with them, using the time picker, the legend, the tooltip, and the drilldown options, and to export and share the visualizations and dashboards, using the link, the embed code, or the PDF options.
